How to Make a Personal System Map
A guide to create the ultimate tool for self reflection
How to Create a Personal System Map
Systems mapping is a technique used to form a deeper understanding of systems which have complex relationships between their components. A good systems map will give you insight into how different system sub-components interact in previously unknown ways, and help explain why certain counter-intuitive things happen on the system level. Humans are inherently complex, and most spend their lives struggling to answer the age-old questions: ‘Who am I’ and ‘Who do I want to be’. In the journey to try to answer these questions for myself, I’ve mostly read books and written journals and found my answers to these questions change and adapt as I’m exposed to new experiences. However, I’ve always found it hard to see the relationships between the different aspects of my persona and interests, so I wanted to try something different - applying systems mapping techniques to myself.
The premise here is that human beings are complex-adaptive non-linear systems of systems just in their physiology, let alone their psychology. Further, we live in an environment equally as complex, adaptive, and non-linear. It seems only appropriate that we should at least attempt to understand ourselves as such - complex creatures living in a complex universe. Fortunately for us, the techniques behind systems mapping are relatively simple. The hard part is trying to understand the system as a whole, in this case, yourself.
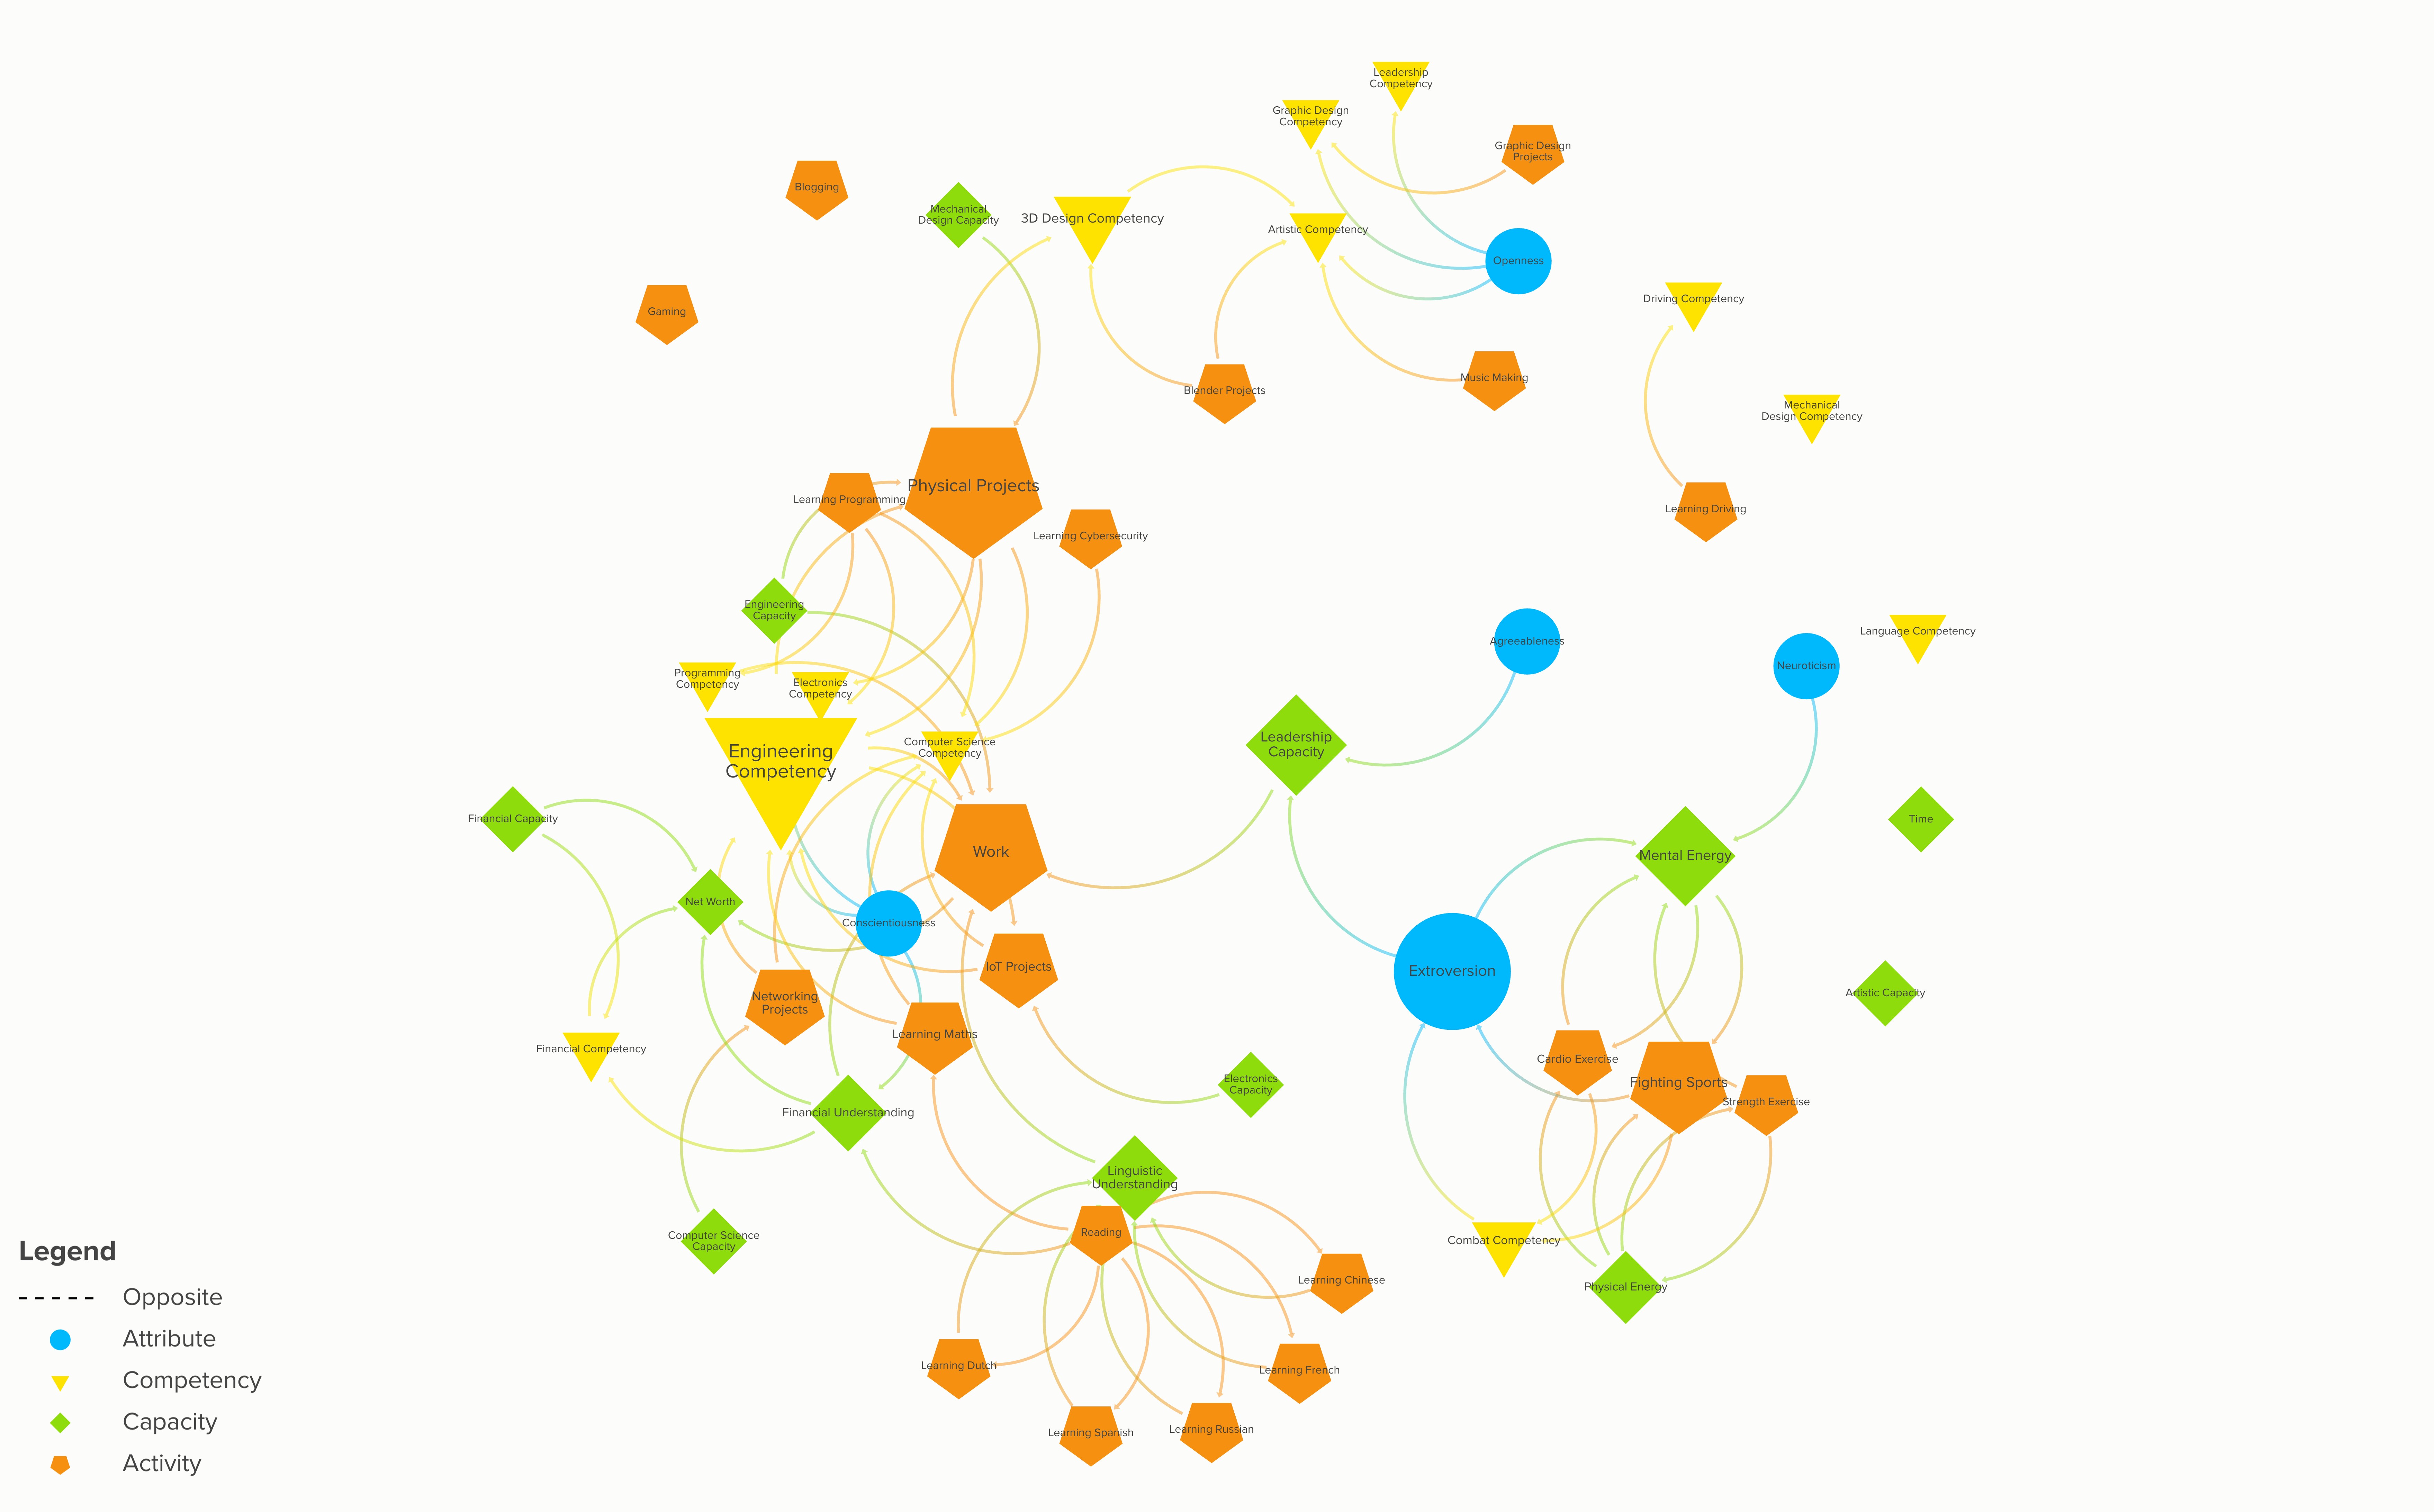
Example System Map
The Process
First, I’ll describe the process of creating a systems map with free and easily accessible resources on the Internet. You will need two tools:
There are three key steps:
Generate data based on the Kumu data structure in Google Sheets. (template below)
Import the data into Kumu and style.
Analyse the insights from your map.
The Template
Let’s first look at how to use the Google Sheets template, so that Kumu can automatically generate the map for us.
Elements
Start by opening the Template - you should see something like the image below:
A Label is simply the name of an element of a system. Elements can have multiple characteristics. In our case, a label has a Type, a Description, Tags and Web Links. You can add more columns to add more characteristics.
Connections
At the bottom of the sheet, you will find the second tab, connections: 
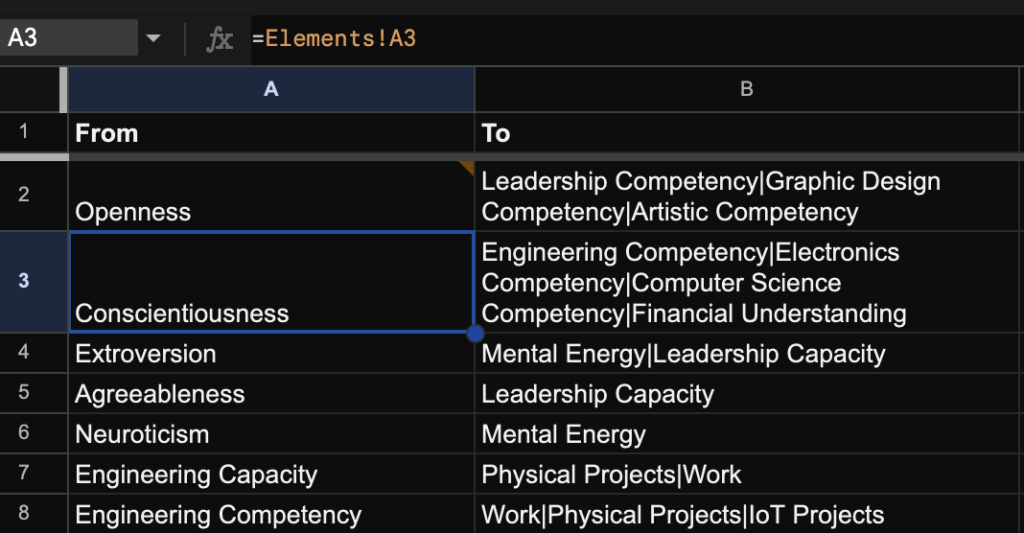
Connections are made From the element in column A To the element(s) in column B.
| Note: that elements in the To column are separated by the ‘pipe’ | character. You can label the type of connection, as well as the strength of the connection. |
The Result
If you follow the Sheets import guide by Kumu, you will have a basic system map as shown below:
So, you’ve created a system map, consisting of three elements, with relationships between them. By looking at the above map, we can say that an increase in element 1 leads to an increase in element 2. Element 1 and element 2 feed back into each other, in what is called a reinforcing loop - these two elements contribute to each other’s growth, therefore they grow exponentially. Intuitively, you can see that Element 1 is the most important, as it has the most connections. If we wanted to grow all of our elements (ie grow the system as a whole), we know that we should focus on growing element 1.
This is a simple map and warrants a simple interpretation. When we’ve developed our full map, we will use more sophisticated methods, using graph theory and leverage points.
Creating Your Personal Map
A Framework for Personal Maps
This is one of the hardest and potentially longest parts of the process, generating data based on you. The following framework seeks to categorise the different component parts that consitute you. The framework relates attributes, aspects, capacities, competencies and activities in a way that enables a system map to emerge.
We will be borrowing concepts from the following resources:
- The Systems Mapping Overview
- Systems Mapping
- The Big 5 Personality Traits
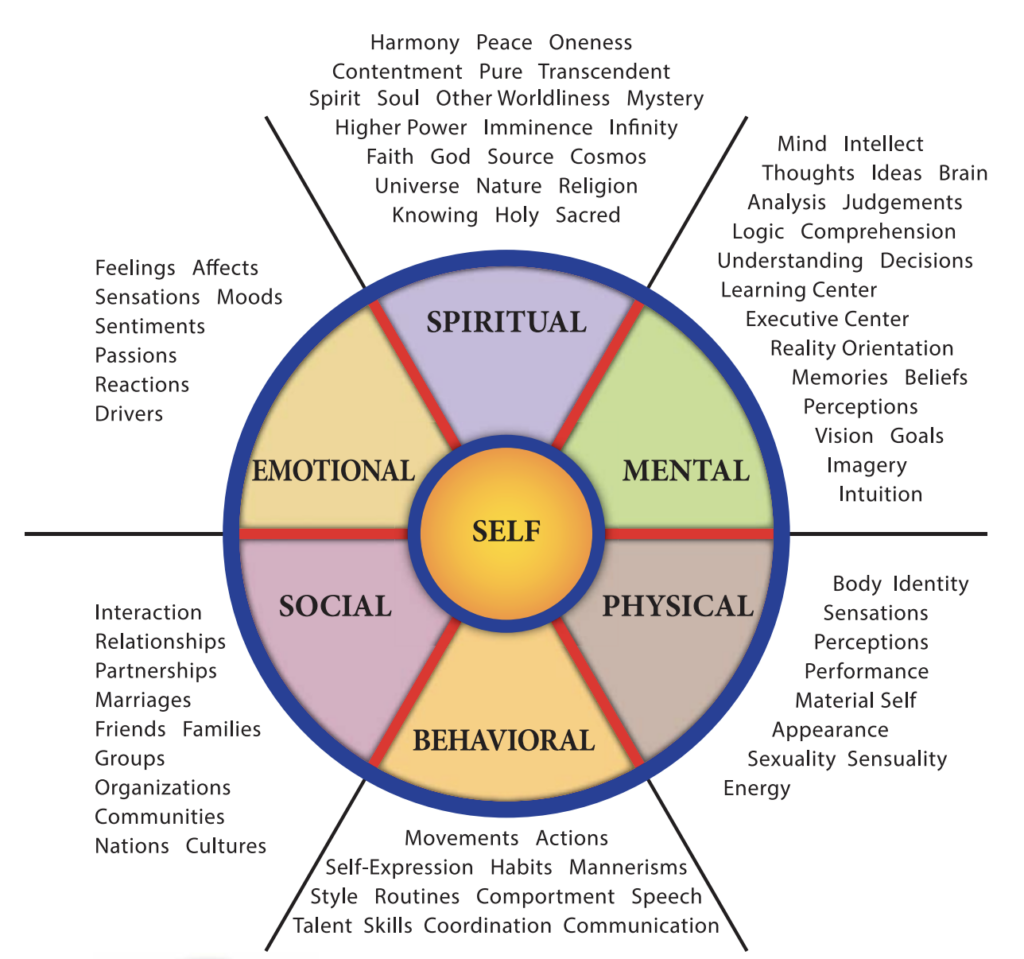
- The Seven Aspects of Human Beings
Your Attributes
Let’s start with attributes. Attributes in this case are based on the Big 5 (Openness, Conscientiousness, Extroversion, Agreeableness and Neuroticism). There are multiple online tests for the Big 5, and if you don’t know where you lie for each attribute, now is the time to take a test (5 mins max). Create an element for each attribute, and if you want, add your score as a new column. Call element types ‘Attribute’ for each element. Feel free to add more attribute elements if you wish.
Your Aspects
Aspects go in the tags column for the Elements. Tags are used for analysis later on. For each element, stick to a maximum number of tags from the main categories, I’ve chosen 3, less than the 7 presented in Seven Aspects of Human Beings. The tags must contain at least one main category, and as many subcategories as you wish so long as they are related to the main ones. The constraint there is to ensure you can have a meaningful interpretation later on.
Capacities, Competencies and Activities
Next, we put in our competencies, capacities and activities. Competencies are topics that you are good at or want to get better at. Capacities are the willingness, drive and time commitment you have to put towards doing something. Activities are things that you do or things that you’d like to do.
Capacity and activities lead to competency. Activities, which take from capacity, lead to an increase in competency. An increase in competency leads to a reduction in the time commitment required by related activities, and either an increase or a decrease in drive/willingness.
Capacities
Capacities can be thought of as water storage tanks, which can fill up and drain. Storage tanks in reality have a physical limit; you can’t fill a water bottle more than 100%. However, since we are dealing with abstract concepts, there may be capacities that don’t have a limit.
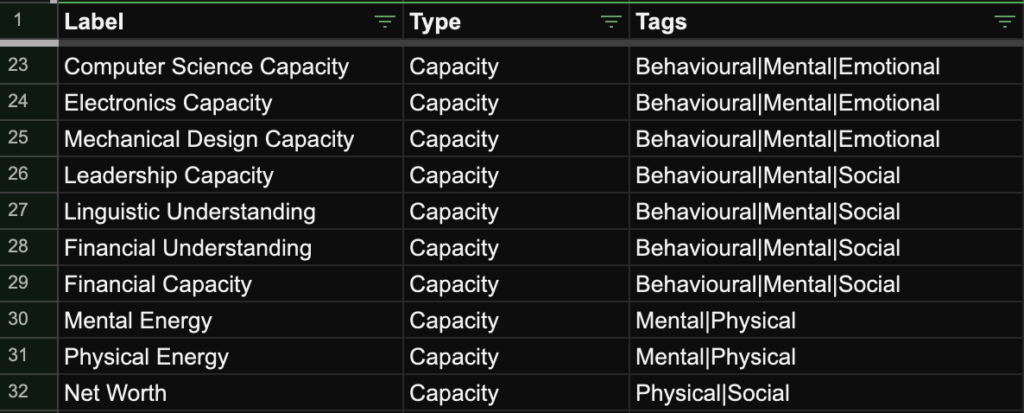
In this case, whilst capacities can be related to competencies, other aspects must be considered. For example, mental and physical energy are two capacities worth considering, which are more or less limited. An example of an unlimited capacity would be net worth. I’ve added these, but feel free to add more.
Here are some example capacities:
Competencies
Competencies are things that we are good at or want to get better at. Competencies can be practised and improved through activities.
Here are some example competencies:
Activities
Activities are anything you might do or want to do on either a regular, semi-regular, or fixed-term basis. Exercise (daily), Financial Planning (monthly), and a RasPi project (fixed term) are examples of each. Add as many as you like, and make sure they relate in some way to the previous capacities and competencies you’ve laid out.
Here are some example activities: 
Defining System Boundaries
Up to this point, we’ve considered elements unique to you as a person. As the mapper, you ultimately decide when to finish the mapping process and move on to the analysis. You could map every atom inside you with the whole universe (let me know if you manage), but that would likely take more than a lifetime. Regardless, setting a system boundary gives you important context when interpreting the map.
As you may have noticed, the example given focuses on my professional development as an early-career engineer, as well as exercise and some other factors. As such, there is a bias towards my behavioural aspects. This can be extended as much or as little as you wish. You might want to do a map based on your emotional, spiritual, or physical aspects. To expand your map to include the world around you, consider the environmental, technological, social and economic factors of the present day.
So how do you define the boundary? By targeting the problem youre trying to solve. Are you trying to understand how you relate to the world? Maybe focus on various external factors which influence you. Are you trying to develop a set of skills? Focus on the capacities, competencies and activities.
Creating Links
Now we move on to creating links between our elements. In creating links, we establish relationships between different elements. I’ve related all the elements in the ‘from’ column to the label column in the Elements sheet. This makes it easy to make sure you’ve made all the connections you want.
Making connections between elements can take some time, and determining what relates to what isn’t always clear. The rule I’ve used is: ‘If in doubt, there probably is a relationship’. You may use a different approach, and you can always adjust and change it later.
Types of Relationships
Kumu also enables you to include whether a relationship contributes or detracts from the target element, so in the above example, openness contributes to leadership competency etc with a strength of 100. Conscientiousness in the above example detracts from engineering competency etc. These are just examples, in my final map I don’t use types or strengths because I don’t feel I need that detail.
Analysing Your Map
System mapping is a way to incite action, and especially if you’re going through the process of generating a personal system map, you’re likely looking for ways to move forward with this “new found perspective”. Creating a personal system map really is like having an abstract mirror pointed towards you, it is one big feedback mechanism, and feedback necessitates action more often than not.
There are two key aspects to analysing a system map. Firstly, we use graph analysis to measure what parts of the map constitute what is important based on different mathematical criteria. This can help derive actions to take, for example, you may see that you want to develop a particular skill. Second, we explore the concepts of leverage points, which is a particularly useful approach with so many interweving and intertwining relationships.
Metrics and Styling
Generating Metrics
Before we delve into making decisions, we need to generate the numbers as well and decide on a way to style the graph.
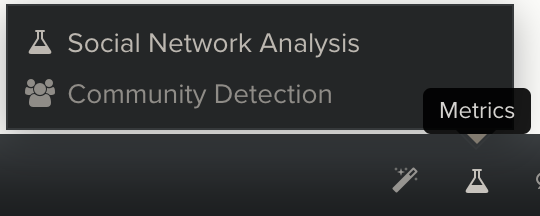
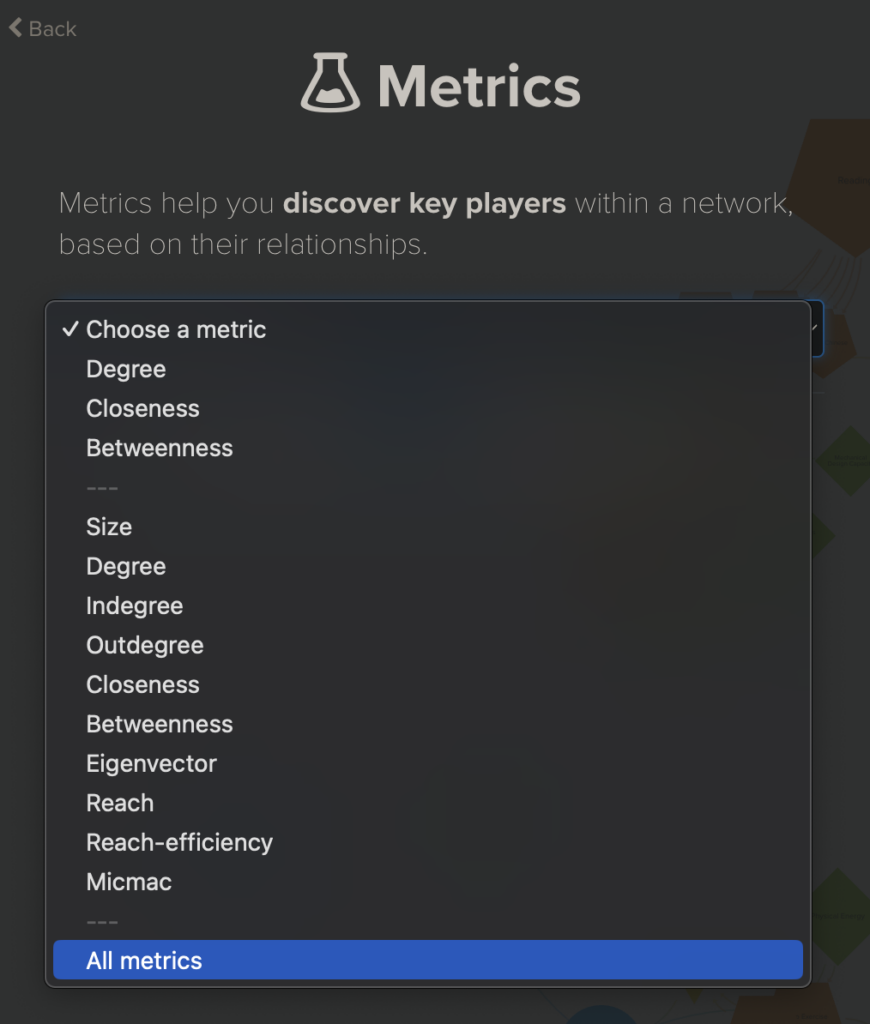
Start by selecting the flask on the bottom right of your imported map, and select Social Network Analysis. When the pane opens from the right, select All metrics.
Now that you’ve run the analysis, you have a bunch of metrics to analyse how different elements of our graph relate to each other! If you select any element, you can now see each one of these values per element.
Styling
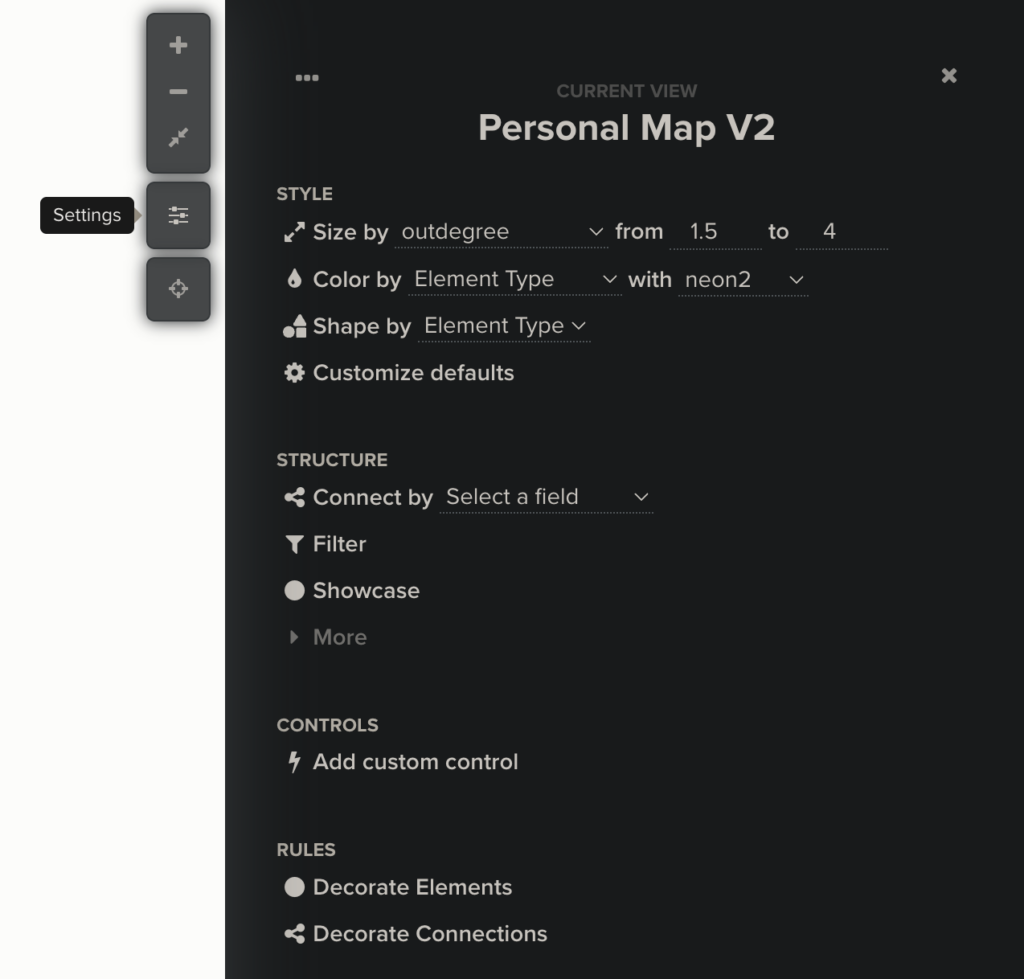
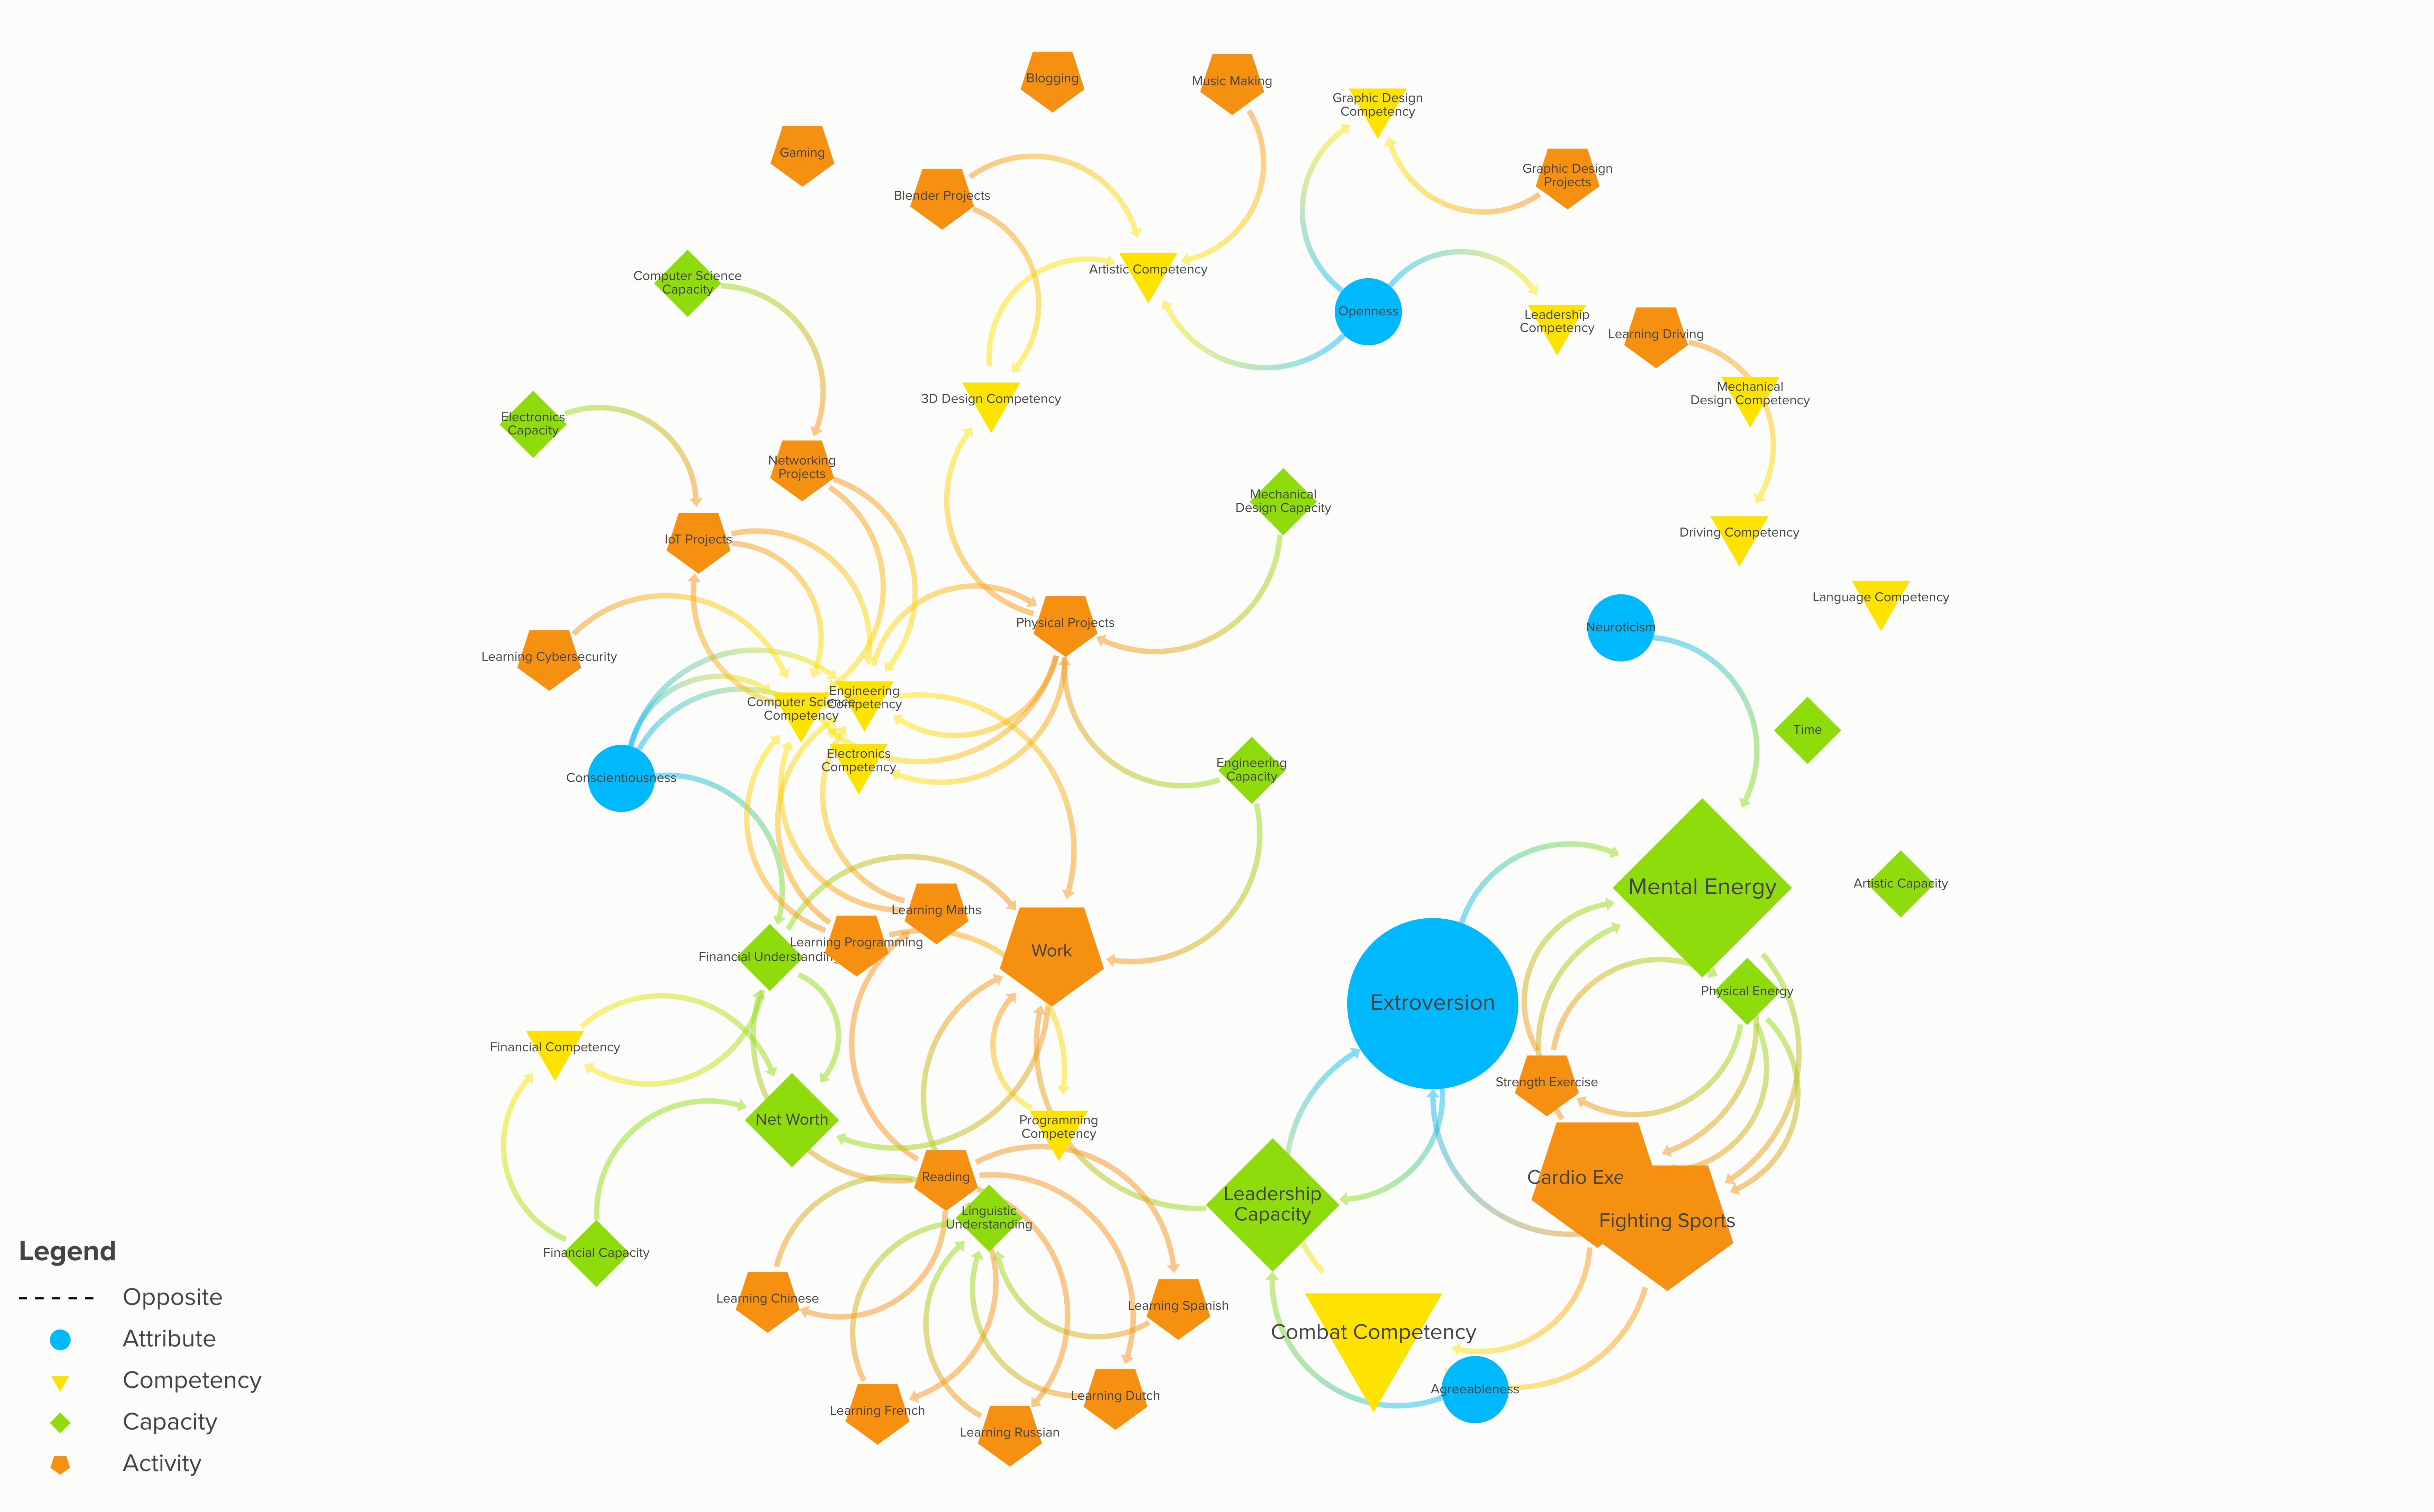
Now that we have our metrics, one of the most useful ways to use them is through styling our map. Select settings on the right, and adjust our settings using our metrics. In the below image, I’ve decided to use ‘outdegree’ to determine element size and decided to use colours and shapes determined by element type. Change these to suit our needs or emphasise particular aspects of our map.
Graph Analysis
Graph analysis relies on graph theory, there is a good introduction here. Since we are interested in the relationships between elements, we focus on centrality. Centrality is a measure of importance for any given element based on its connections. Reach measures how easy it is to get from one element to another, but we won’t use that in our graph analysis. You can find out more about centrality metrics here and reachability here. The Wikipedia articles for Graph Theory, Network Theory, Centrality and Reachability are also worth a read but focus more on the underlying maths. The four centrality metrics I’ve found most useful when analysing my map are in-degree, out-degree, betweenness and eigenvector centrality.
In-degree and Out-degree Centrality
Elements with a high in-degree centrality have a high number of outgoing connections and can be thought of as sinks. As the opposite of Indegree, elements with a high outdegree centrality have a high number of outgoing connections and can be thought of as sources.
In-degree Map
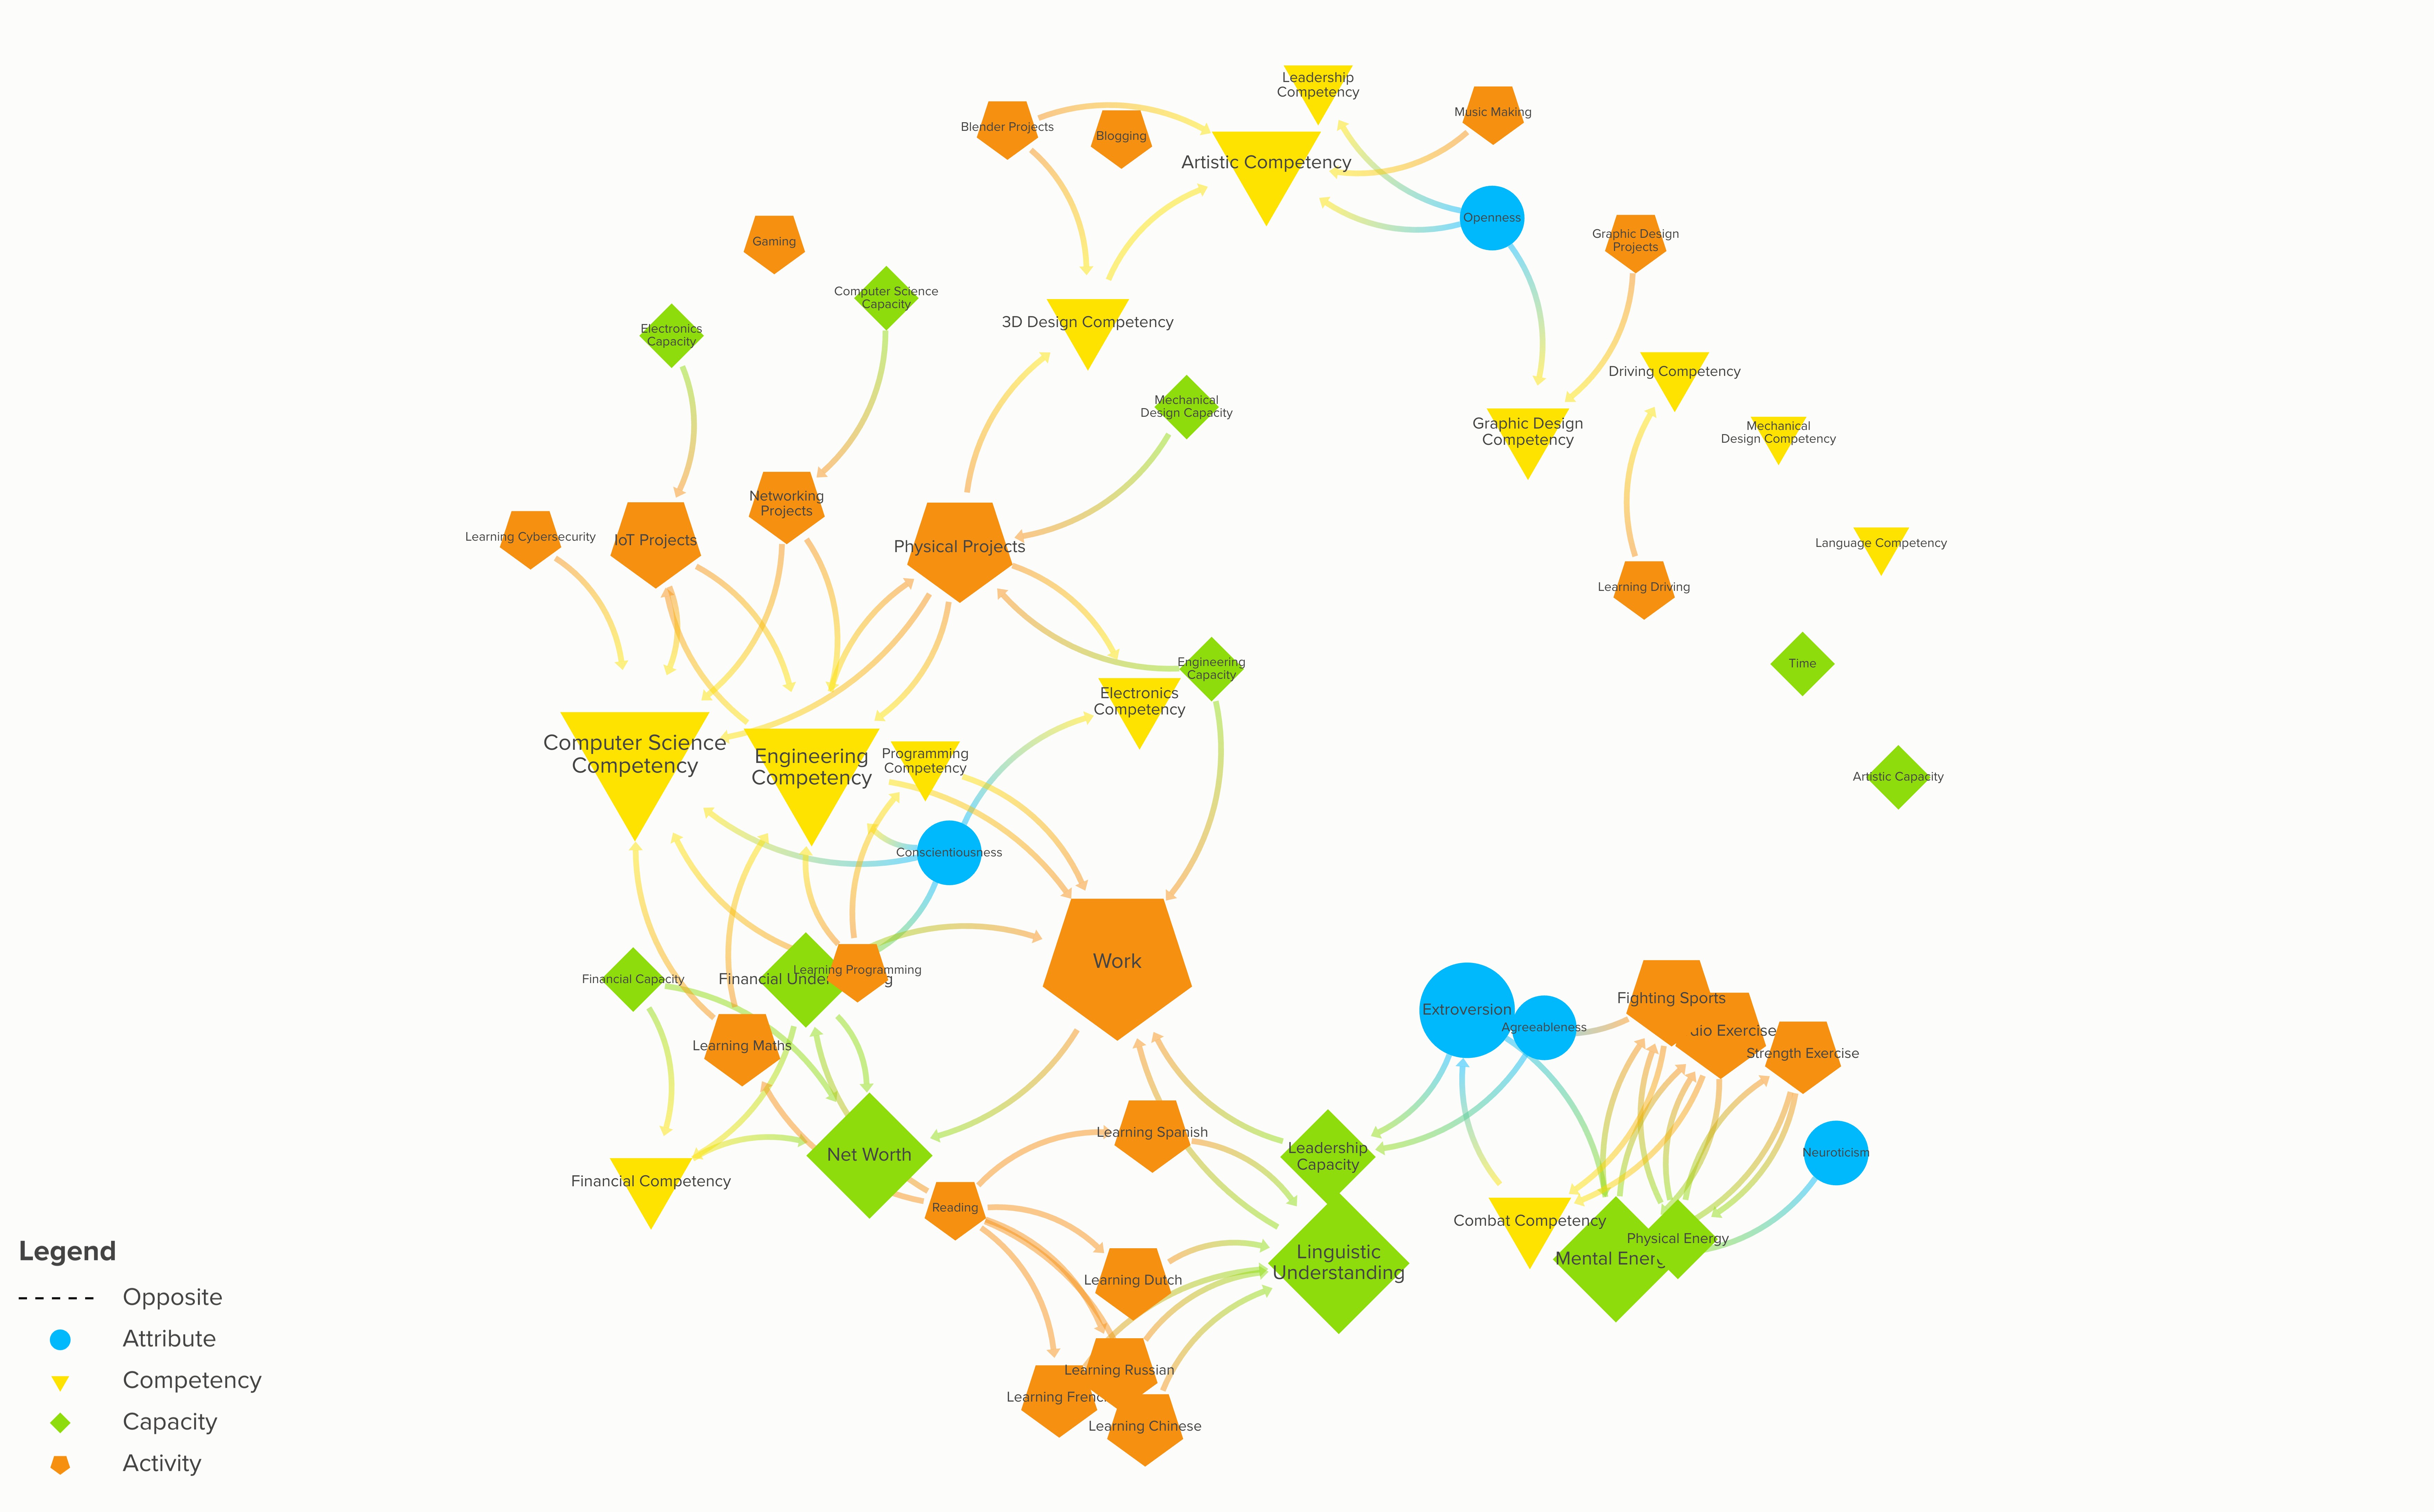
From this graph, I can see that I put significant effort into developing my engineering competency, computer science competency, artistic competency, and linguistics. I also put a fair bit into my work and net worth. However, I can see that I’m currently not putting much effort into my electronics or 3D design. To change this, I might think of some new activities that would help me develop that part of my skill set.
Out-degree Map
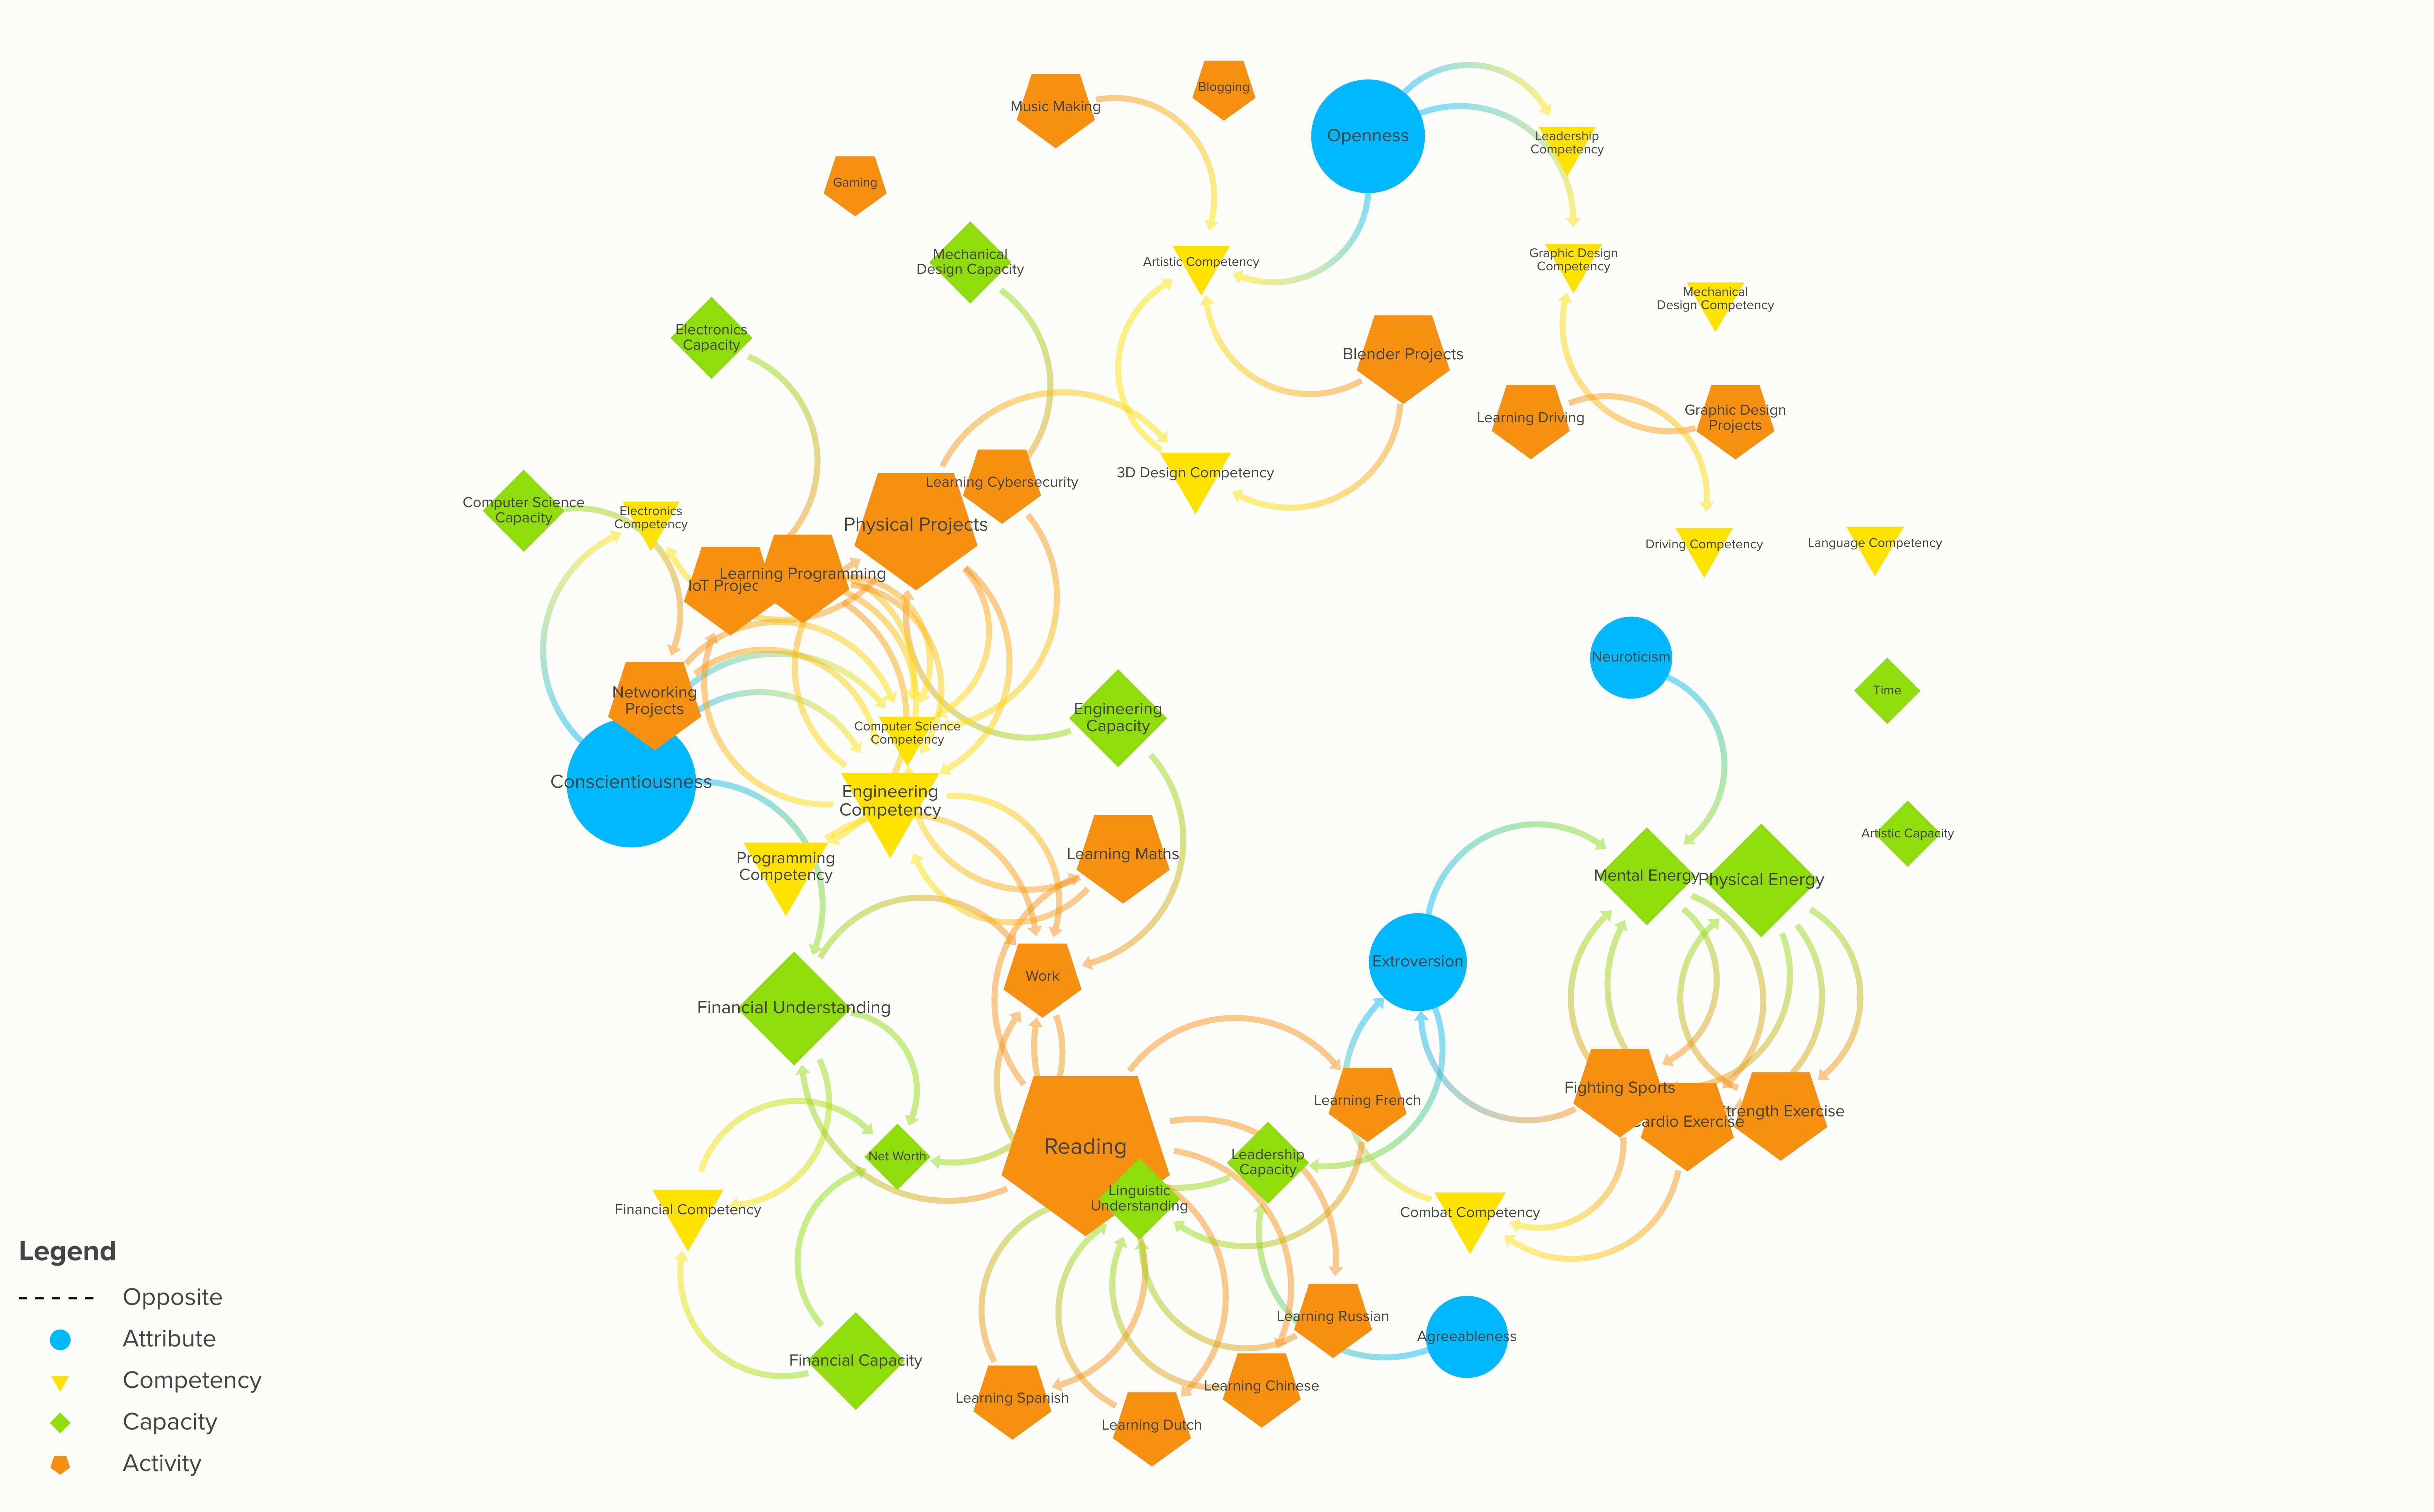
Notice your big 5 attributes, I score relatively highly in conscientiousness, and through no intention it is the largest of the big 5 for my personal system map. I also score relatively highly in openness, which is the second largest on the map.
Betweenness Centrality
Elements with a high betweenness centrality are facilitators. These are the elements which play the biggest role in linking elements together. A person in a network that has a high betweenness centrality is someone who acts as a link between people. If you are the only one who knows everyone at a party, you are the highest in betweenness centrality.
Eigenvector Centrality
Elements with a high eigenvector centrality can be thought of as the most influential across the map. Eigenvector centrality looks at the importance of elements, relative to all other elements. This is similar to the Pagerank algorithm, used by Google to determine what websites to show you - lots of less important websites frequently link to more important websites. This is why Wikipedia ranks so highly on so many search queries.
Leverage Points
Leverage points are used to steer the behaviour of complex systems. The concept was conceived by Donella Meadows, one of the pioneers in using systems thinking to address societal problems. You can find her original writing here.
There are 12 leverage points that Meadows mentions in her works, in increasing order of effectiveness:
- Constants, parameters and numbers (such as subsidies, taxes, standards).
- The sizes of buffers and other stabilizing stocks, relative to their flows.
- The structure of material stocks and flows (such as transport networks and population age structures).
- The lengths of delays, relative to the rate of system change.
- The strength of negative feedback loops, relative to the impacts they are trying to correct against.
- The gain around driving positive feedback loops.
- The structure of information flows (who does and does not have access to information).
- The rules of the system (such as incentives, punishments, constraints).
- The power to add, change, evolve, or self-organize system structure.
- The goals of the system.
- The mindset or paradigm out of which the system — its goals, structure, rules, delays, parameters — arises.
- The power to transcend paradigms.
Naturally, some of these leverage points are more relevant to a personal systems map than others. For example
Closing Comments
The reason making a personal system map takes so long is not due to the process itself, but rather because there are many aspects that make you up as a human being. A personal system map allows you to glimpse into your inner world, which is by nature complex and convoluted. Similarly, there may be many relationships between the things that you do, and I hope that going through the process of creating a personal system map has given you some insight into yourself that you may not have had previously.
Finally, I see my personal system map as something growing and evolving with time. We ourselves are dynamic systems, which means we change and evolve with time. My personal goal is to keep track of and refine my map as I continue to age, and hopefully end with an interesting representation of the life I lived.


